A New Era Of Automated Macro-Data Charts Via AI-Driven News Research

The Evolving Landscape of Data Journalism
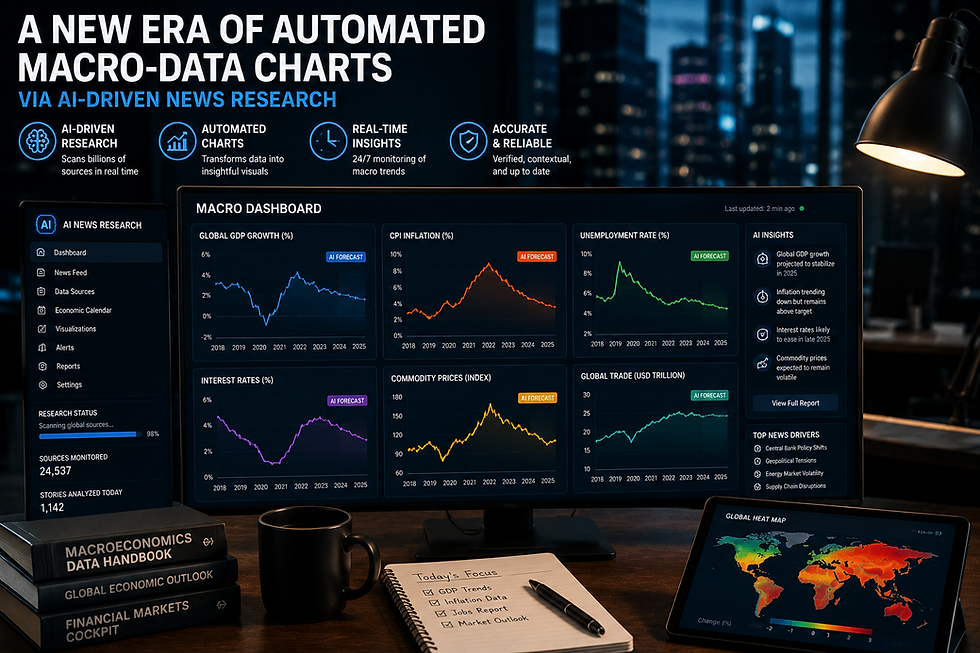
In the age of digital journalism, news is no longer merely a description of events; it has become a vital medium for data-driven analysis. Vast amounts of statistics regarding economic growth, inflation, unemployment, GDP, stock markets, and global trade emerge daily. Making these complex figures comprehensible to the average reader has long been a challenge for media organizations. This is precisely where AI-driven news research for automated macro-data charts is opening doors to new possibilities.
Artificial Intelligence is no longer limited to just writing news articles. It can analyze massive datasets and automatically generate charts, providing readers with clear and reliable information in mere seconds. This transformation is becoming a hallmark of modern data journalism.
How AI is Transforming Macro-Data Reporting
Macro-economic data is constantly changing. Previously, journalists spent significant time gathering data from various government and international sources, organizing it, and then creating graphs or charts. Now, AI-based tools can automate this entire process.
These systems identify new data, compare it with historical records, and generate trend lines, bar charts, or other visualizations in moments. This accelerates reporting speed and minimizes the risk of human error. Editorial teams can now focus less on data compilation and more on in-depth analysis and explaining the implications of the data.
The Significance of Initiatives
In the realm of data-driven journalism, modern platforms like NewsBolts demonstrate how the combination of AI and automation can significantly enhance newsroom efficiency and workflows. Features such as automated chart generation, real-time data updates, and visual storytelling not only save journalists time but also present complex economic information to readers in a simplified format.
In the future, such platforms could play a pivotal role in making data journalism more accurate, faster, and interactive at local, national, and global levels.
Benefits for Readers
The greatest advantage of automated macro-data charts is that readers are spared the need to pore over long, complex statistical tables. A well-designed chart can clearly illustrate whether inflation is rising or falling, the direction of employment trends, or the state of a country's economic growth.
Visual presentation makes information more memorable. Research indicates that people grasp graphs and charts more quickly than text. Consequently, AI-driven charts are making journalism more effective and reader-centric.
Significant Challenges Remain
While AI-driven reporting offers numerous advantages, its success hinges on data quality. If the source data contains errors, AI might present that flawed information in an appealing chart format. Therefore, human editorial oversight remains essential.
Furthermore, issues such as transparency in AI decision-making, source credibility, and algorithmic bias require constant attention. The fundamental objective of journalism is not merely speed, but also accuracy and impartiality.
The Way Forward
In the coming years, AI-driven news research and automated macro-data charts could become integral to the media industry. Real-time data analysis, interactive visuals, and personalized news experiences will elevate reader expectations. The role of editors will also evolve, shifting focus toward data interpretation, contextualization, and fact-checking.
AI is not replacing journalists but rather emerging as a powerful ally. If technology is utilized with responsibility, transparency, and editorial standards, data journalism can become more credible, impactful, and useful than ever before. This will be the defining characteristic of the smart newsroom culture of the future.



Comments